Sure, pie charts can be boring. But when they’re part of your free WaterSmart home report? That’s a yummy slice of water savings!
I’ve spent a lot of time looking at pie slices lately. More specifically, slices of a WaterSmart pie chart. And when it comes to these slices, the smaller the better because that is a sign of a water-efficient household.
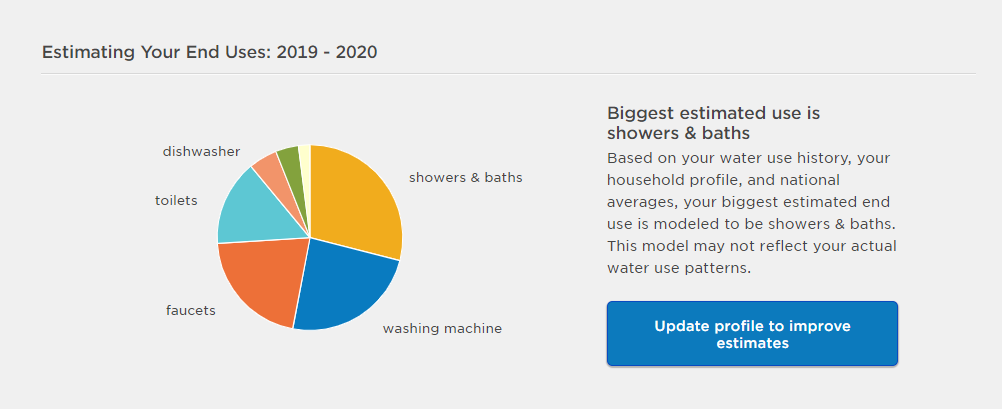
If you’re a fan of data like I am, you’ll want to sign up for our free WaterSmart Home Report. Every month you’ll get a detailed breakdown — in the form of a pie chart — of when and where you’re using the most water, as well as ways to help you use less.
You can quickly and easily compare your indoor and outdoor use, like showers, toilets and irrigation, which are estimated based on your monthly meter reads, property size and the profile you create when you sign up.
Save a Slice Just for You
WaterSmart also provides water-saving recommendations based on your profile. Set it up to include the number of occupants in your home and whether you water with a hose, sprinklers or automatic irrigation system. Make sure to include any pools, spas and other water-related items so WaterSmart can provide you with the most accurate report. You can update your profile at any time.
You can also compare your household’s water-efficiency to similar homes. Keep in mind this includes homes throughout your service area, not just your neighborhood. Other tools to help you save water include a step-by-step guide to help you identify leaks.
A Water Drop in Time
You can also see a timeline of your water history. If you’ve been in your home a while, it’s like a stroll down memory lane. I can see peaks in our water use and remember oh, that’s when we had a leaky toilet or that’s when the water heater died — it’s kind of fun!
The timeline also makes any seasonal water use patterns obvious. Mine has higher peaks in the summer months, a sign of outdoor water use. Looking back, I can see summers where I used more water than usual when I planted a new garden or when it was especially hot and dry.
Got (Extra) Gallons?
If you’re startled by extra gallons on your water bill, you can do some quick math and examine your water use patterns to see what’s happening.
-
- Estimate indoor use. On average, people use 1,500-2,000 gallons of water indoors in a month, so multiply that by the number of people in your household for an estimate of your monthly indoor water use.
- Monitor outdoor water use. This often goes up during the summer and it’s easy to water more than necessary, especially if you have an in-ground irrigation system. An average one uses 2,000 gallons each time it runs. If you run it weekly, you probably use about 8,000 gallons of water outdoors in a month. Add that to your indoor use and compare it to your bill. Is it off by several thousand gallons? It could be your sprinkler settings or a leak. We offer free no-contact irrigation consultations.
- A garden hose usually uses 9-14 gallons of water per minute, if you are hand-watering, filling pools, etc
- Look at your water use patterns. Here are three things to look for:
- Consistent low-water use year-round with a big spike in the last month or two. Leak alert! Use WaterSmart’s leak guide or check out our leak detection videos.
- Low-water use in the winter followed by a wave in the summer months. Again, this indicates outdoor water use.
- A high peak in the middle of a summer wave usually is a sign of a leak or a change in irrigation settings.
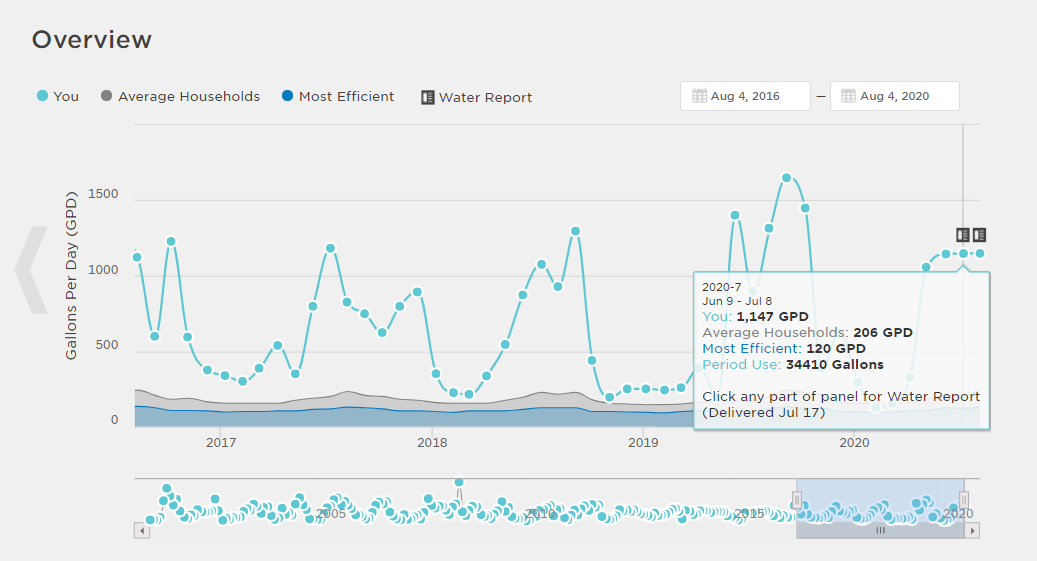
This graph shows an opportunity to save on summer landscape watering with an Irrigation Consultation.
And if you really want to dive deep into your water data, check out our Flow Sensor Rebate for devices that show your water use in real time using the power of your smartphone.